| We are testing a Tubelight at 220 Volts UPS AC input. We are using Embuilt SPEA-1 to test the Bulb properties. |

|
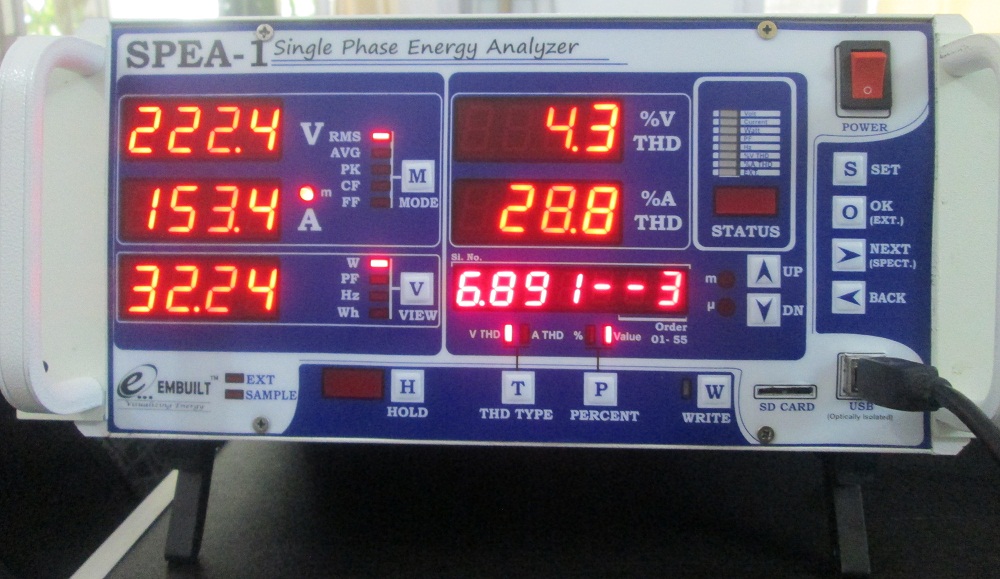
When power is on the following results are found –
| Vrms- 222.4 Volts | VTHD% -4.3% |
| Arms -153.4mA | ATHD% -28.8% |
| Watt -32.24Watt | V 3rd Harmonics Value – 6.891Volts |
Here we can see that VTHD is 4% which means UPS Supply has 4.3% distortion in Voltage. It also effect the wave form of UPS Supply or we can say that Voltage waveform is not 100% sine wave(Ideal condition).
ATHD % is 28.8% which means LED Driver(Internal in LED Bulb) distorted the AMPS waveform by 28.8 %. It also has effect of Voltage THD.
We can see the 3rd harmonics of Voltage is 6.891 Volts.
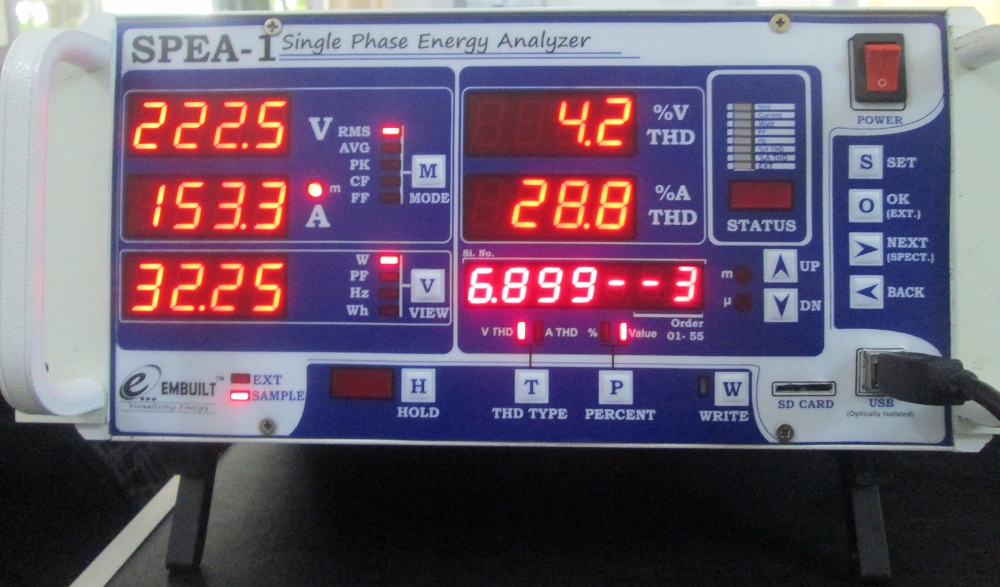
Here we can see the 3rd harmonics of voltage in % of first harmonics. 3rd Voltage harmonics is 2.8% of Vrms Harmonics.
Here we note that ideally first harmonics is to be equal of Vrms and other order harmonics are to 0. So we need to minimize the harmonics.
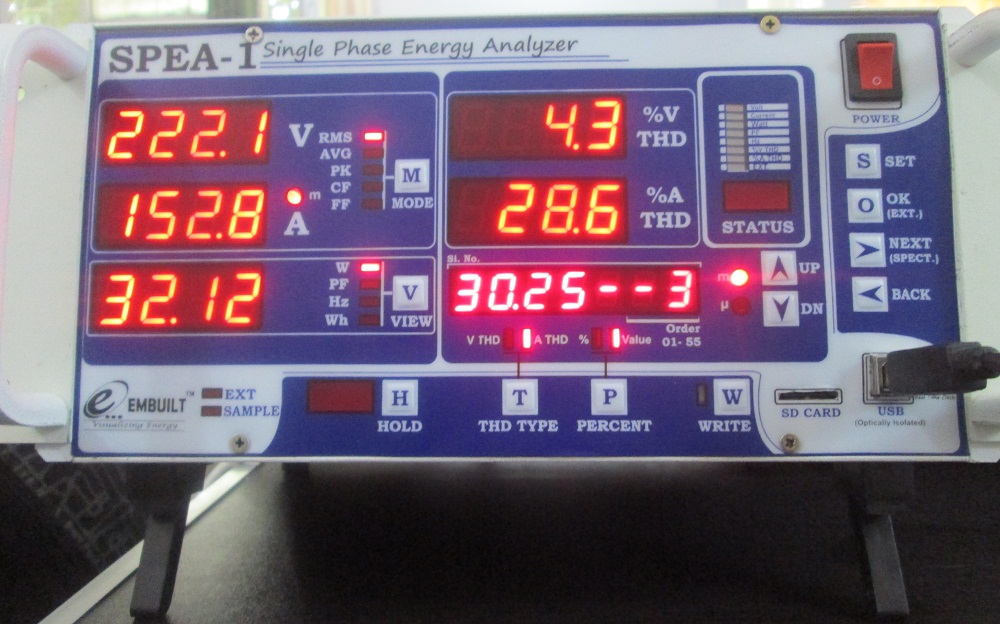
Here we can see the 3rd harmonics Value of Amps. It is 30.25mA. Other harmonics can be seen using UP/DOWN Buttons.
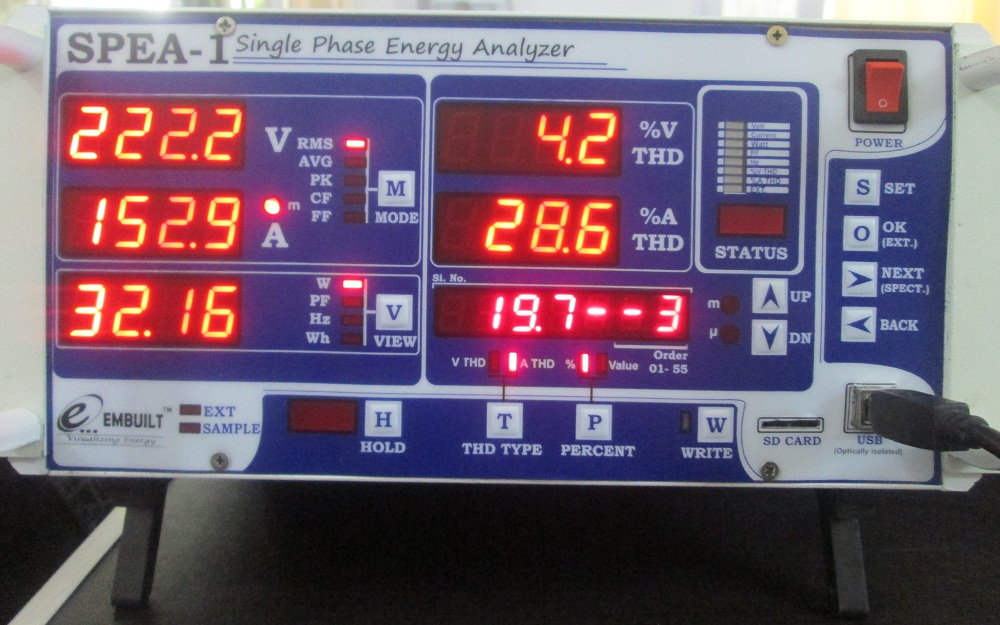
In the above image 3rd Harmonics of Amps shows in display 6. It is 19.7% of Arms (152.9mA).
Other parameters can also seen on SPEA-1.
You can also view readings on the SPEA-1 Software.
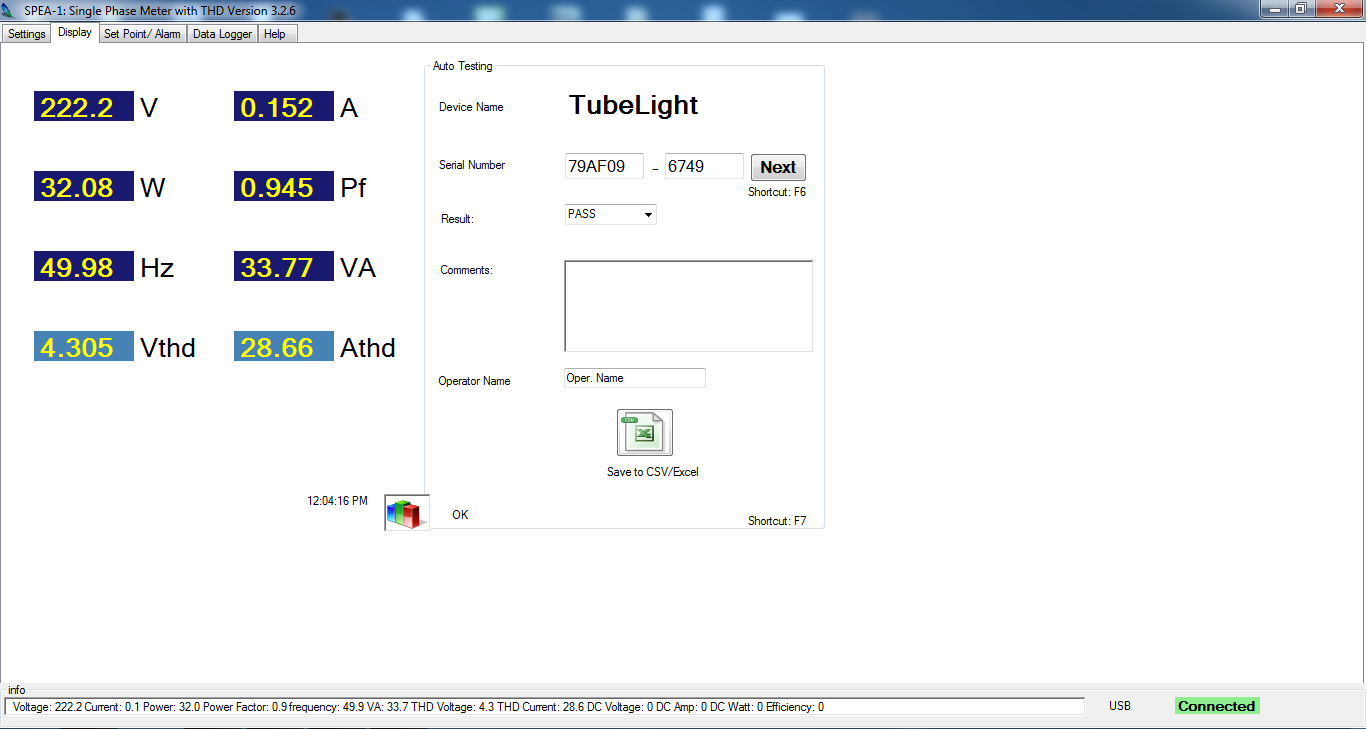
Softare is connected to SPEA-1 for real time data viewing and reporting.
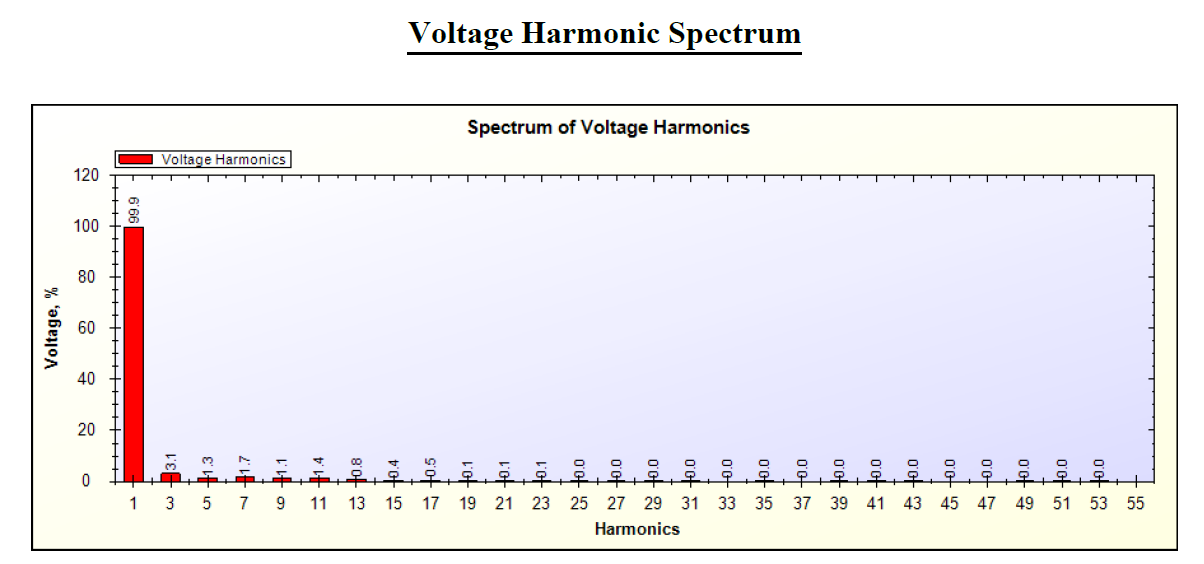
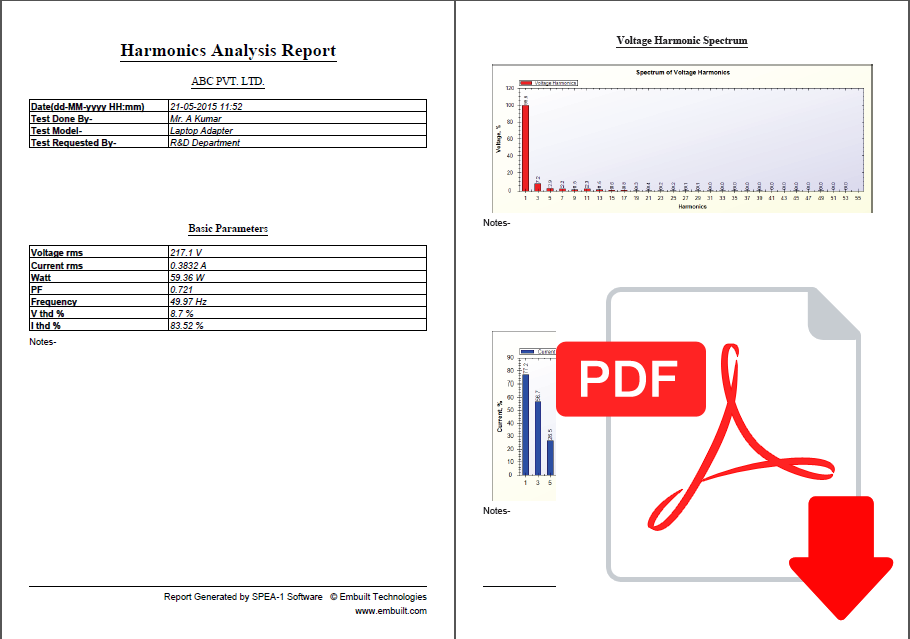
Above is the voltage harmonics spectrum. All values are given in % of Vrms.
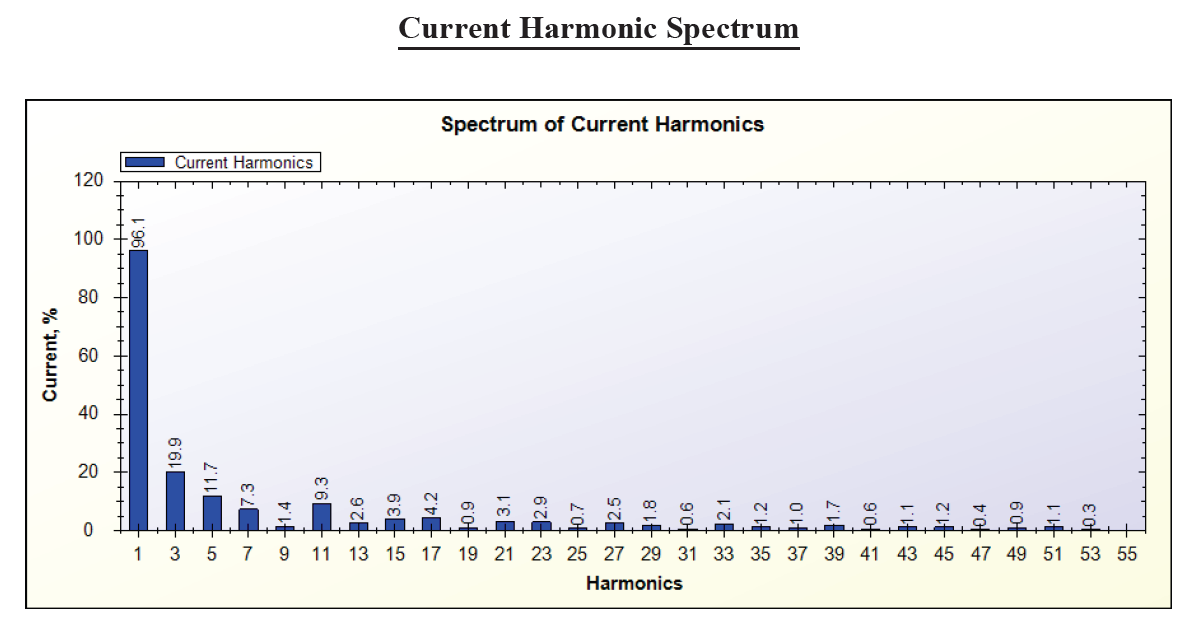
Above is the Amps(Current) harmonics spectrum. All values are given in % of Arms.
Harmonics report is also generated which contains the parameter values with Harmonics spectrum.